
1× · 5.8 s
Conjoint Demand Curve
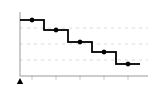
CSSA marker runs along the price axis and the share-of-preference step curve is uncovered behind it, each price point landing as the sweep reaches it until the whole demand schedule stands.
The Free licence asks for one visible credit per page: Animation by Pulsar, linked to Pulsar. The credit line is that link, ready to paste. The snippet itself carries attribution in a comment and in the SVG’s metadata, and never links anywhere on click. Licence
- Tier
- CSS
- Dependencies
- None
- Duration
- 5.8 s, loops
- Categories
- Loaders and spinners, Data and progress
- Use cases
- Determinate progress, Dashboards and reporting
- Industries
- SaaS and software, Insurance, Management consulting
- Style
- Data mark · light stroke
- Set
- conjoint
- Tags
- chartlinewipeprogressloop
Companion assets
The same artwork, not animated. Derived from the entry’s own resting state, so it matches exactly.
From this family15 in Conjoint
See the familyConjoint Dominated Profile
Conjoint Competitor Entry
Conjoint Preference Heterogeneity
Conjoint Holdout Validation
Conjoint Attribute Importance
Conjoint Brand Feature Interaction
Conjoint Attribute Levels
Conjoint None Of These
Conjoint Part-Worth Utilities
Conjoint Share Simulation
Conjoint Repeated Choice Tasks
Conjoint Trade-Off Task
Conjoint Willingness To Pay