1× · 5.1 s
Hypothesis Test Statistic
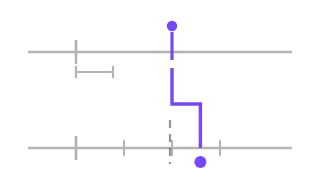
CSSA raw difference measured against a one-standard-error bracket is traced down onto the standardised reference axis, where it lands beyond the critical mark.
The Free licence asks for one visible credit per page: Animation by Pulsar, linked to Pulsar. The credit line is that link, ready to paste. The snippet itself carries attribution in a comment and in the SVG’s metadata, and never links anywhere on click. Licence
- Tier
- CSS
- Dependencies
- None
- Duration
- 5.1 s, loops
- Categories
- Data and progress
- Use cases
- Dashboards and reporting, Documents and files
- Industries
- Healthcare and life sciences, Management consulting, Cross-industry
- Style
- Data mark · light stroke
- Set
- hypothesis
- Tags
- chartlineloopminimalstroke
Companion assets
The same artwork, not animated. Derived from the entry’s own resting state, so it matches exactly.
From this family15 in Hypothesis
See the familyHypothesis Effect Size
Hypothesis Equivalence Test
Hypothesis Type I and Type II Errors
Hypothesis False Positive Risk
Hypothesis Confidence Interval
Hypothesis Multiple Comparisons
Hypothesis Null and Alternative
Hypothesis Permutation Test
Hypothesis Power Curve
Hypothesis P-Value Tail
Hypothesis Sample Size
Hypothesis One-Tailed and Two-Tailed
Hypothesis Error Trade-Off